Test Farm
Our own 5-hectare waterfront farm. The first FarmHUD installation. Built, mapped, and running.
This is not the only kind of property FarmHUD is built for. It is where FarmHUD was proven. The test farm gave us real conditions, real problems, and real data to build against.
5 ha
Property size
7
Active zones
30
Sensors deployed
90+
Days live
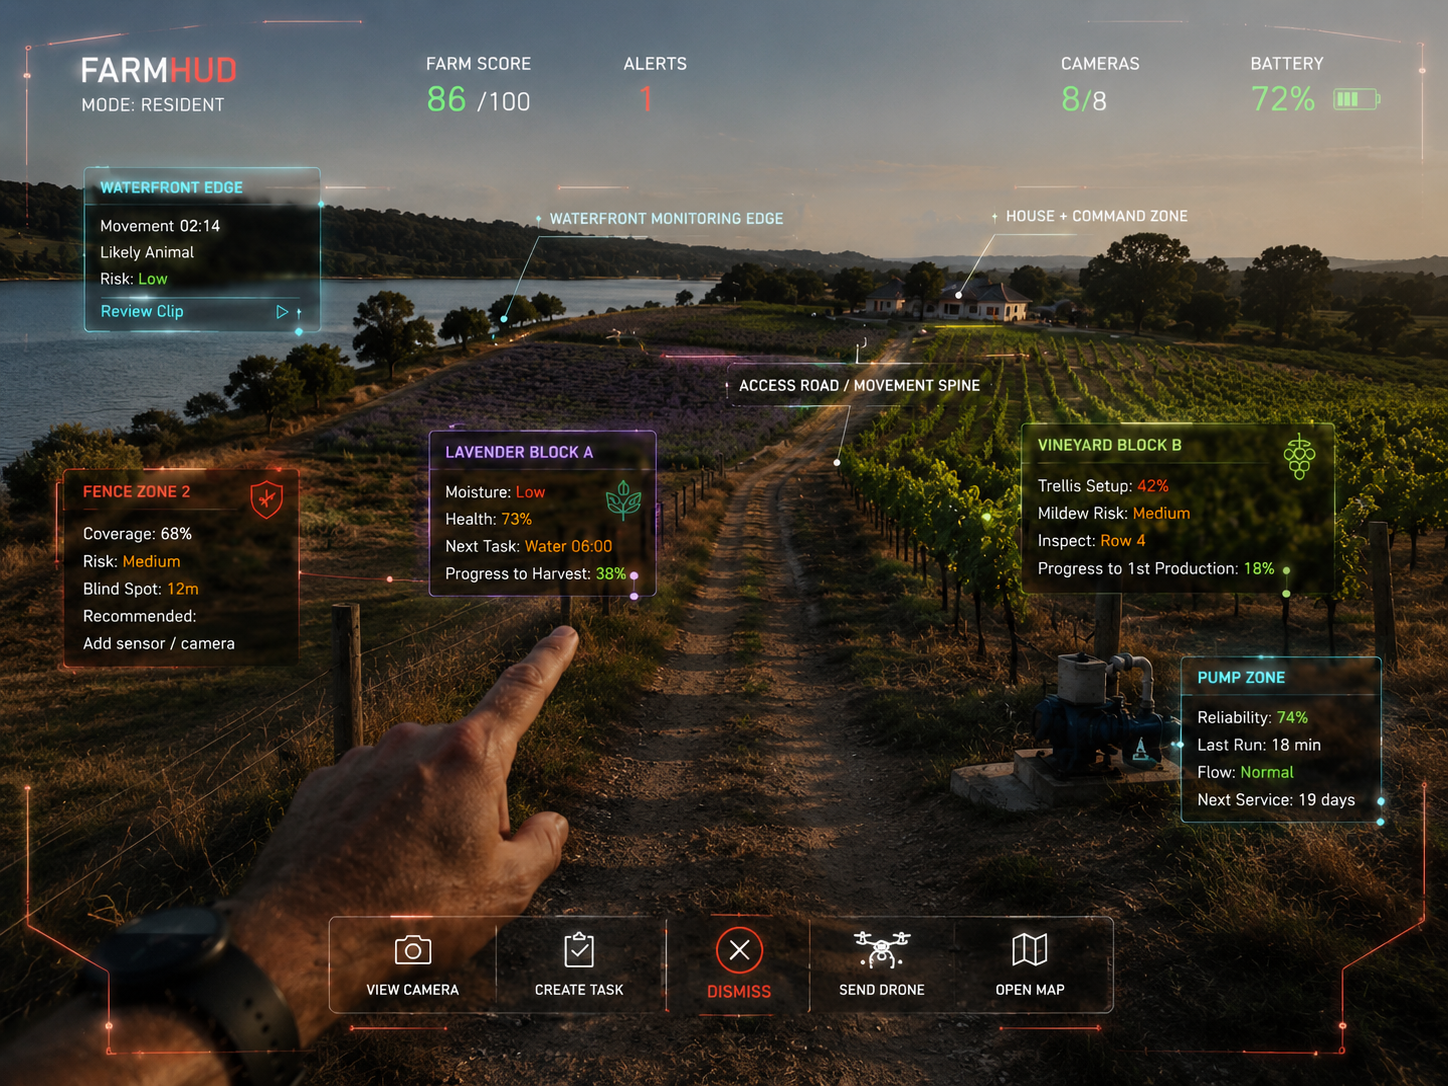
What the owner sees
The test farm through the HUD lens.
This is a concept view of what FarmHUD looks like in practice. Zone overlays anchored to the real land. Live data surfaced where it matters. Actions available without looking away.
The lavender block shows moisture and health. The vineyard block shows trellis status and mildew risk. The fence zone shows coverage gaps. The pump shows reliability and next service.
Not a dashboard
This is not a screen on a wall or an app on a phone. It is a spatial HUD layer rendered inside smart glasses — the kind of bespoke intelligence system FarmHUD designs for each property after mapping the land, connecting cameras and sensors, and training machine-learning around the actual farm.
Actual FarmHUD concept view: a bespoke HUD layer built around our first 5-hectare waterfront test farm.
Origin
Why we started with our own farm.
We began building FarmHUD because ordinary farm security systems show alerts, but they do not understand the land.
A motion alert near the waterfront is different from a person near the fence, a vehicle at the gate, or a pump running outside its normal schedule. Generic systems treat all of these the same way. They push a notification and move on.
Our own 5-hectare waterfront farm became the first proving ground: irregular boundary, waterfront edge, access road, house zone, open movement areas, future crop blocks, security zones, and infrastructure that needed to be understood as one system.
We could not build a credible bespoke installation service without first building it on real land with real problems. The test farm is that proof. It is also where we found the problems we did not expect — and solved them before bringing the system to any other property.
What we learned
A motion alert without classification is almost useless.
The waterfront sensor triggered 40+ alerts in the first two weeks. Most were birds or tidal movement. It took two weeks of labelling to get the model to a state where waterfront alerts were reliable. This is the work generic systems skip.
The access road is the busiest zone on the property.
We assumed the gate zone would generate the most events. It was the access road — every vehicle, person, and animal that moved through the centre of the farm. Training vehicle classification there first was the right call.
Infrastructure data matters as much as security data.
The pump running outside schedule was the first real operational alert the system generated. Nothing security-related — just a pump running when it should not have been. That kind of alert does not exist in a security-only system.
The HUD is only as good as its zones.
The zone boundaries we set on day one were wrong in two places. After three weeks of live data, we adjusted them. Bespoke installation is not just about hardware — it is about learning the land.
Property map
7 operational zones across a 5-hectare waterfront property.
Waterfront Boundary
Northern edge follows the tidal waterfront. Passive sensor array monitors for boat approach and water-level changes. Camera coverage of the full water edge.
Sensor type: passive IR + acoustic. Camera: 1× wide-angle PTZ. Alert threshold: movement within 15m of water edge after dark.
Command Zone
House and operations hub. Primary HUD base station installed here. Network backbone, camera control server, and UPS infrastructure all housed in this zone.
Hardware: HUD base station v1, 4× PoE cameras, network switch, 4G backup uplink, 12hr UPS. Uptime: 99.8% over 90 days.
Internal Access Road
Single access road running through the centre of the property. Vehicle recognition active — trained to distinguish property vehicles from unknown.
ML model: vehicle classification v2. Training set: 847 labelled events. Accuracy on property vehicles: 96.3%.
Open Movement Zone
Central open paddock. ML model trained to distinguish livestock from wildlife from vehicles. Zero false positives in last 30 days.
ML model: movement classification v3. Classes: cattle, kangaroo, dog, vehicle, unknown. Events today: 34. Anomalies: 0.
Fence Boundary
Full perimeter fence line monitored. Electric sections include voltage sensing — drops below threshold trigger alert. Camera coverage at all corners.
Fence length: ~820m. Electric sections: 3. Voltage sensors: 3. Camera coverage points: 4.
Access & Gate Zone
Main property entry. Camera with plate recognition active. Automated gate with open/close logging. Current alert: gate open for 23 minutes — unscheduled.
Gate events today: 7. Plate recognition attempts: 7. Matched: 6. Unknown: 1 (alert sent 23 min ago). Gate status: OPEN.
Future Crop / Sensor Zone
South-east sector earmarked for crop monitoring in next phase. Soil moisture sensors, irrigation flow monitoring, and crop health cameras to be installed.
Planned sensors: 4× soil moisture, 2× irrigation flow, 1× multispectral camera. Target install: Q3.
Implementation log
From first site visit to live HUD in 21 days.
This is what the FarmHUD implementation process looks like in practice. Every step is documented — not just as a record, but as a template for future installations.
Your installation would follow the same phases. The timeline depends on your property size, infrastructure, and priorities — not on a fixed product schedule.
Site Assessment
Full property walk. Infrastructure audit, zone identification, camera placement planning. Existing fencing, power, and comms assessed. Boundary walked and measured on foot.
Drone Mapping
5-hectare property mapped via drone. 847 frames captured. Property boundary, internal road, fence line, and water edge traced to sub-metre accuracy. Waterfront edge documented at high and low tide.
Hardware Install
Base station installed in command zone. 6 cameras mounted. PoE network run. 4G backup uplink configured. Full UPS installed. Cable routes documented in the HUD map layer.
ML Training Begins
First 500 labelled events collected. Vehicle, livestock, and wildlife classification model initialised. Zone-specific alert thresholds set based on site assessment findings.
HUD Deployed
Live HUD activated. All 6 zones visible in real time. Alert routing configured. First full night of unattended monitoring completed without incident.
Refinement
Model retrained weekly on new events. Zone boundaries adjusted as operations changed. Gate recognition improved. Waterfront sensor sensitivity tuned after tide data reviewed. This installation will keep improving.
Test Farm Segmentation
The 5-hectare test farm is segmented into real operational zones.
The waterfront edge is treated as a monitored boundary for movement, animal activity, water access, and security risk. The house area becomes the command zone, where the local AI system, camera feeds, alerts, and HUD workflows are managed.
The open land is divided into future production sections: a lavender block for soil-moisture, irrigation, flowering, and harvest tracking, and a grape vineyard section for row-level monitoring, trellis status, pruning schedules, disease risk, and future Brix readings. FarmHUD does not just label the land. It understands what each section is for, what data matters there, and what the owner should see in the heads-up display.
Lavender Block A
Purpose: Aromatic crop trial
Tracked
HUD surfaces
Vineyard Block B
Purpose: Grape / vineyard trial
Tracked
HUD surfaces
Waterfront Monitoring Edge
Purpose: Water-facing security and environmental monitoring
Tracked
HUD surfaces
House + Command Zone
Purpose: Control point for the farm intelligence system
Tracked
HUD surfaces
Access Road / Movement Spine
Purpose: Movement reference for vehicles, workers, deliveries, and security events
Tracked
HUD surfaces
Your property is next
This is what we built on our own land. Now we build it on yours.
Every installation starts with a property assessment. We visit your land, understand your operation, and design a FarmHUD system around what you actually need to see.